
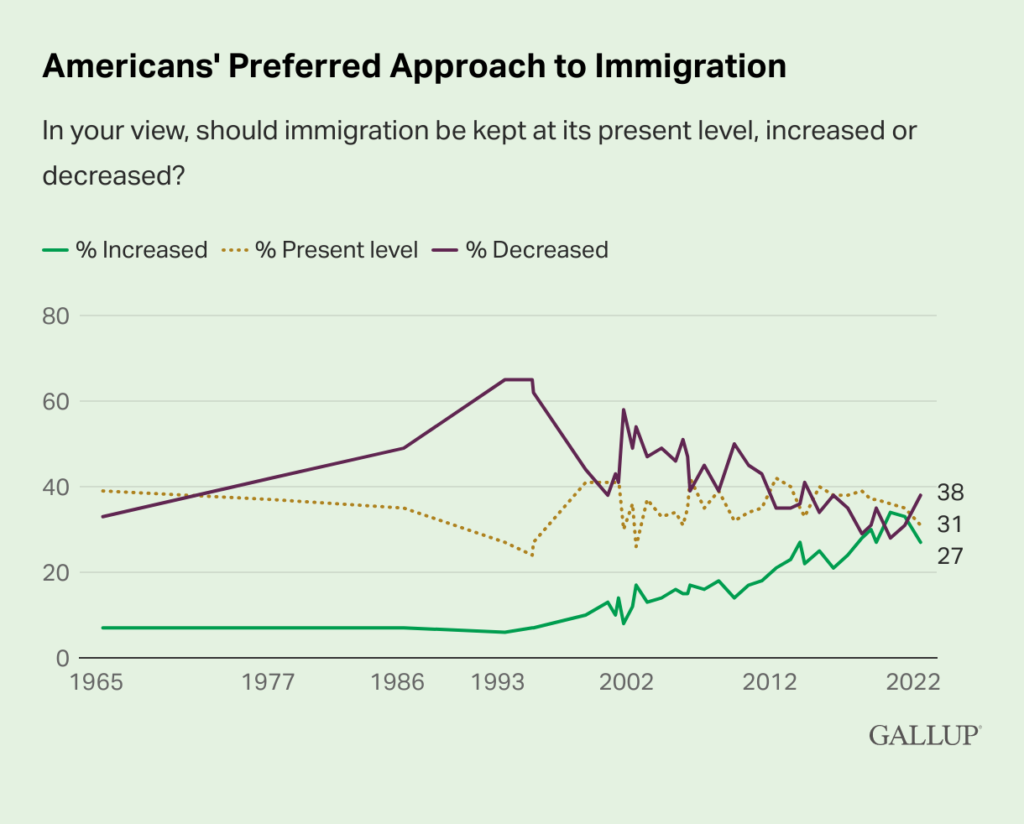
For the first time since 2014, American views on immigration have inverted, with more Americans opposing more immigration than those who say they favor the practice. In a recent Gallup poll, conducted July 5th-26th, the number of Americans who oppose all immigration – legal and illegal – increased 10% in just the past two years. Overall, Americans went from just 28% opposed to more immigration in 2020 to 38% in 2022.
During this time, encounters with illegal border crossers at the U.S. southern border have increased fourfold. In June, U.S. Customs and Border Patrol reported 207,416 illegal encounters, the highest number since 1960.
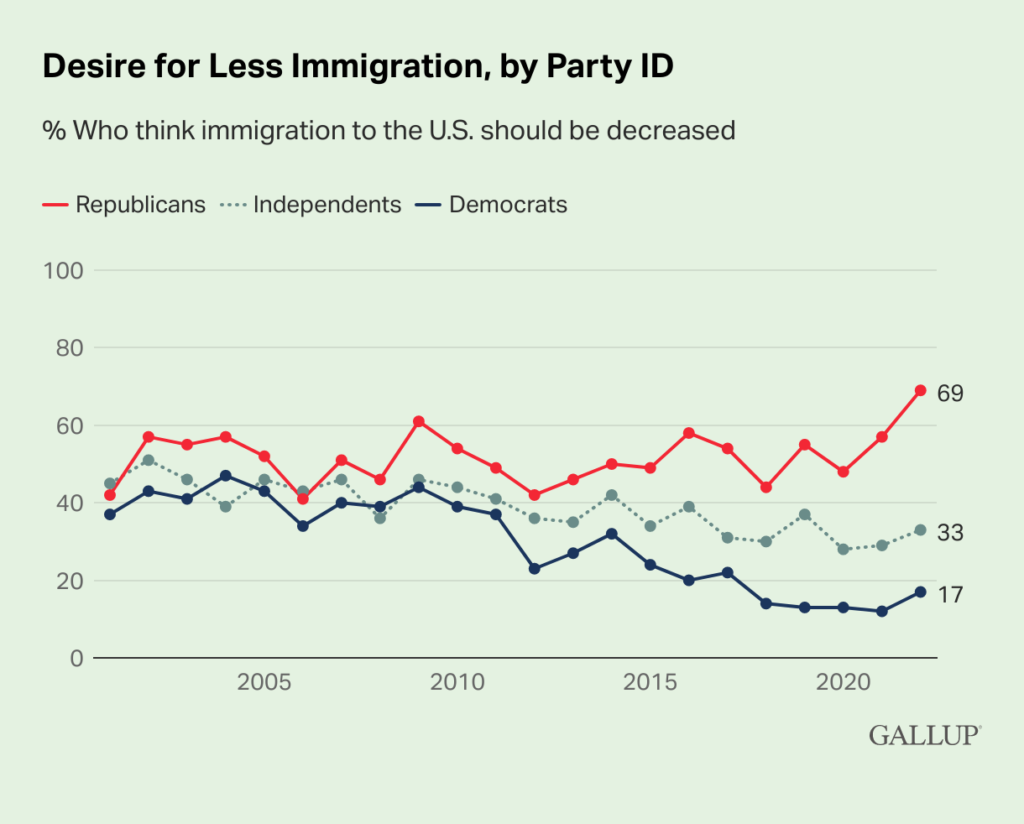
While those for and against immigration remained divided along party lines, there has been a sharp bipartisan shift toward increased opposition. Between 2020 and 2022, Republican opposition increased from 48 to 69 percent and Democrats went from 13 to 17 percent. Independents followed this trend with an increase in opposition from 29 to 33 percent.
Since the passage of the Immigration and Nationality Act of 1965, American support for immigration had been almost statistically non-existent. This piece of legislation was also known as the Hart-Celler act, named after its sponsors, Philip Hart, who was not Jewish, but was a longtime supporter of Zionist causes, and Emanuel Celler, who was Jewish. The act drastically increased immigration and rapidly transformed America’s demography in the coming decades and yet Gallup data from that time shows only 7% of Americans supported increased immigration at the time of the bill’s passage through the mid-1990s. Opposition to immigration increased from 33% in 1965 to an all-time high of 65% in 1995. After 1995, opposition to immigration decreased rapidly as support for it began to steadily rise. It then became highly sporadic and mercurial, and has remained that way ever since.
Gallup also broke down the views by subgroups including gender, age, and education. Without explanation, race and/or ethnicity were not published as an available subgroup. From what was made available, those opposed to immigration trended older and more conservative, while those in favor were younger and more liberal. Women were more opposed to immigration than men by 2 points, 23 to 25, respectively.
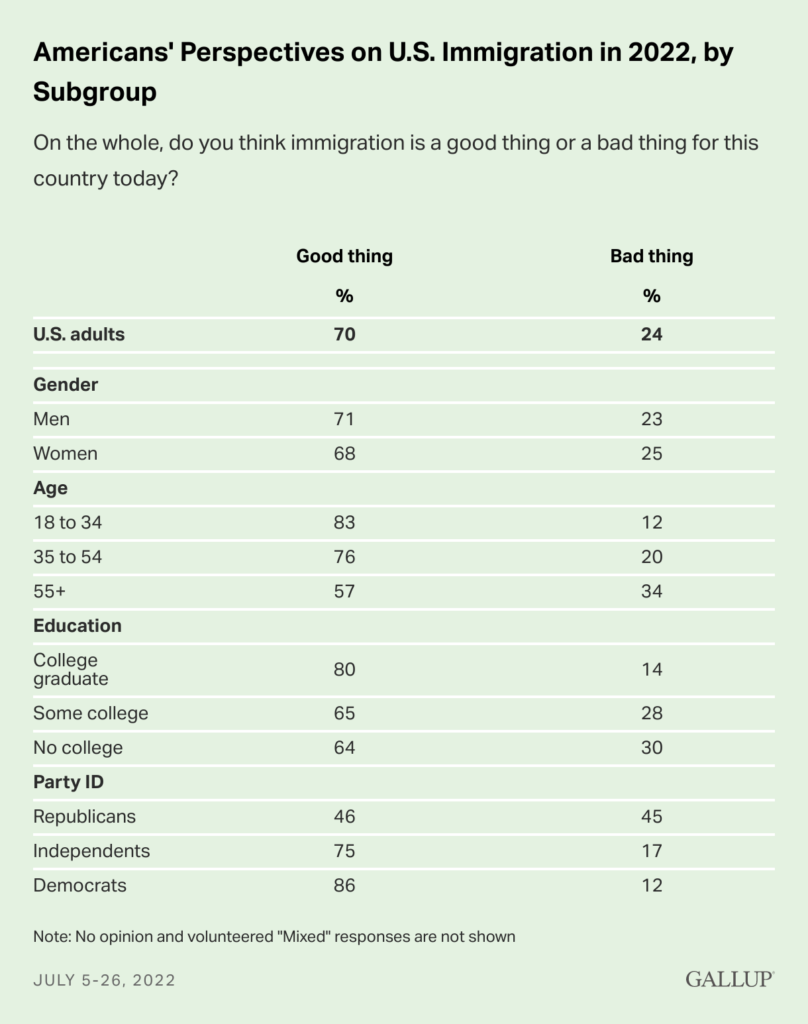
Gallup did not specify legal or illegal, White or non-White immigration, so the meaning was left open to interpretation. Gallup also does not define the terms “good” or “bad” in the context of immigration and likewise leaves their meaning open to those polled.